Fictional client — portfolio build · targets, not field results
Learning Analytics: Diagnose Before You Prescribe
"This training is useless. Fix it." — three dashboards, forty minutes, one discipline: diagnose first.
The Audience
L&D teams with LMS reporting duty — plus managers who read dashboards and act on the loudest tile.
Responsibilities
Metric-family analysis · cohort story design · diagnosis-gated UI · intervention scoring — signal vs noise made procedural.
The Build
Learning-analytics design · dashboard storytelling · gated interaction · AI-assisted drafting (disclosed)
How I used AI in this case
AI drafted cohort-comment variants and dashboard copy; the metric-family analysis, the diagnosis-gated interaction and intervention scoring were designed by hand. Edited, verified and disclosed.
LO1 · Apply
Separate exposure metrics (completion, satisfaction) from learning metrics (deltas, drop-off) on one dashboard.
LO2 · Discriminate
Diagnose the real signal for each of the three cohorts before any prescription unlocks.
LO3 · Perform
Prescribe exactly the two interventions that target the diagnosed signal — per cohort, not generically.
By the end of this experience a learner can do the three things above — assessed by diagnosis + intervention scoring across the three cohorts. Every interaction in the build exists to create the evidence for one of them.
Learning dashboards reward motion over judgment. The same quarter produced three cohorts with three different truths:
Each of these fails differently — and each attracts the wrong fix if you intervene on whatever is loudest.
92%
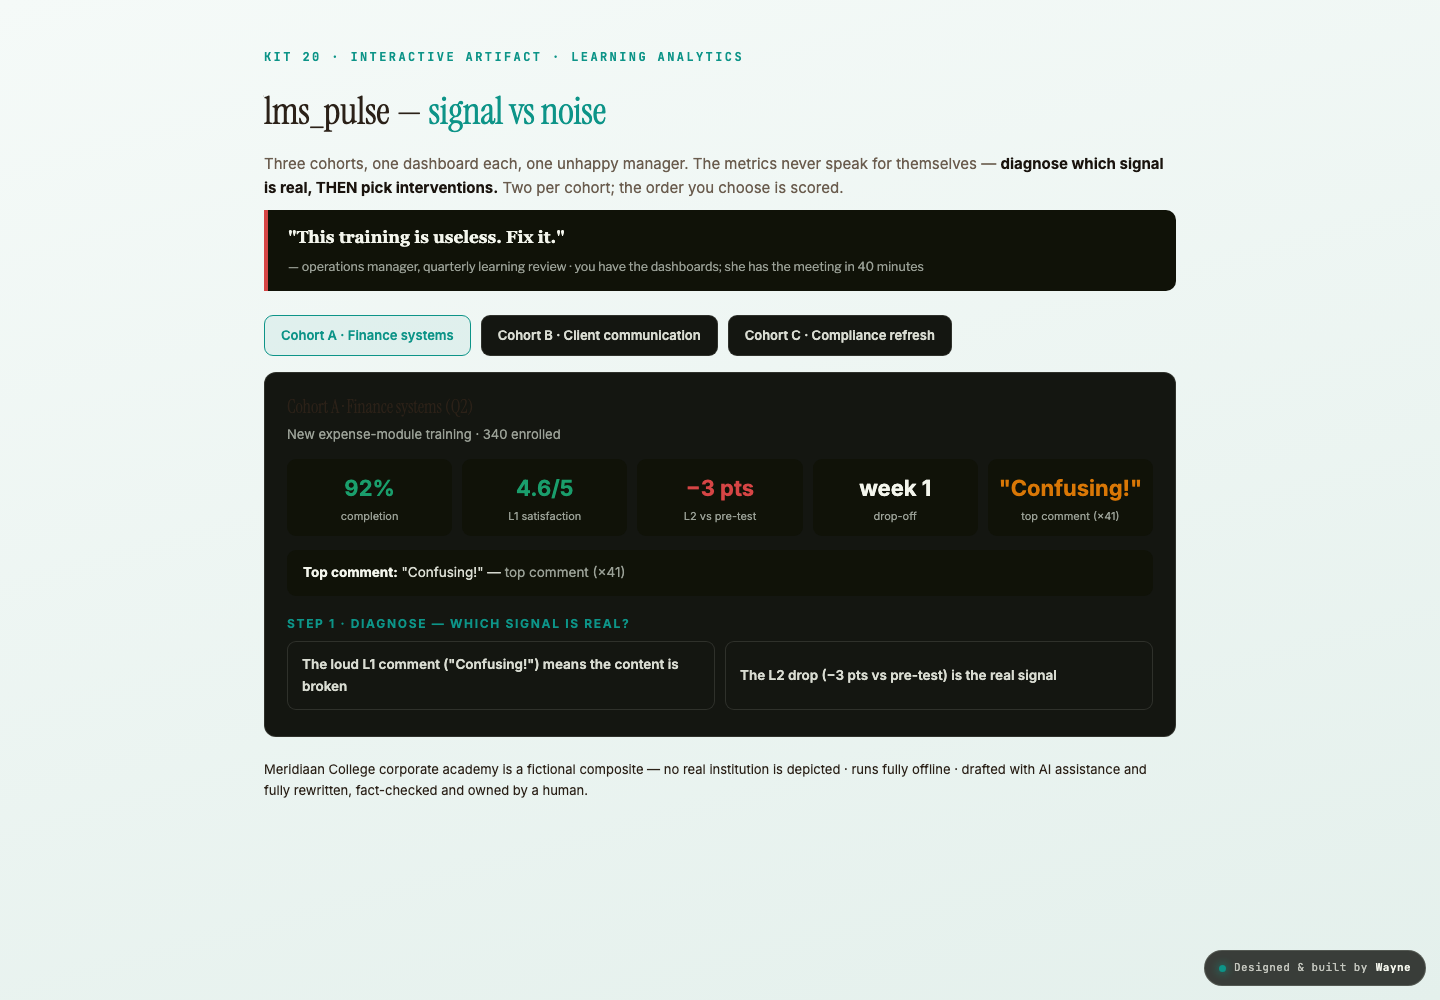
completion, 4.6/5 satisfaction — and −3 pts on L2. People finished happy and knew no more.
38%
completion with +11 pts on L2. The program works on everyone it touches; the schedule kills it.
97%
completion, 4.9/5, +1 pt across 1,240 learners. Perfect optics, near-zero learning.
The problem was the client's. These were mine — the design and build constraints that shaped the solution.
The loud tile is the trap
Dashboards reward the loudest number. The design gates intervention choice behind a correct diagnosis, so acting before reading visibly costs.
Same grammar, different diseases
Three cohorts must share a reporting grammar yet hide different root causes — or the drill teaches tile-reading, not diagnosis.
Two of six is the discipline
The intervention cap forces prioritization. Scoring rewards alignment with the diagnosed story, not activity — doing less, chosen better.
A diagnosis-gated drill-down: pick the real signal per cohort (the loud comment or the L2 delta?), and only then choose 2 of 6 interventions — scored on alignment with the diagnosed story. The debrief lays the three cohort stories side by side: same grammar, different diseases.
The build itself, not a video about it — open it, make the calls, and read what each one costs.
From metric-family analysis to a diagnosis drill — the stages below are the actual production sequence.
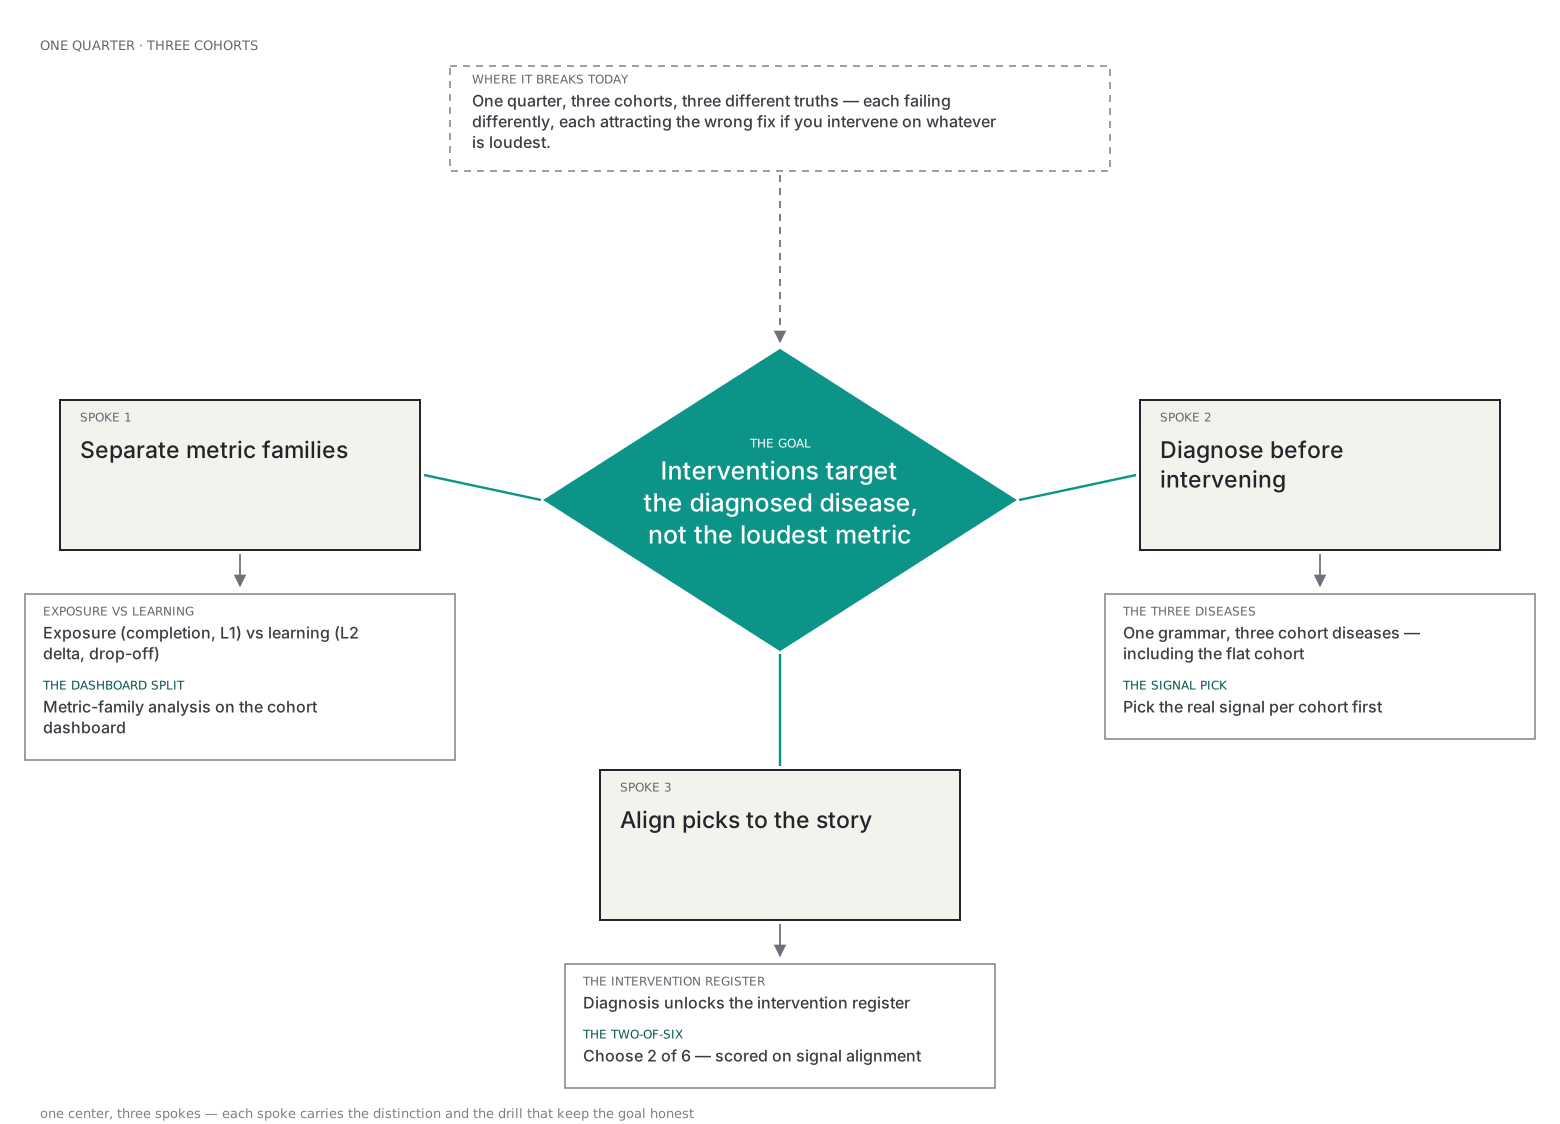
Mapped from one quarter that produced three cohorts with three different truths — each failing differently, each attracting the wrong fix if you intervene on whatever is loudest. The map gates the intervention behind the diagnosis.
The instructional-design foundations that informed this build:
Action Mapping (Clark)
Every behavior the kit produces is traced back to a business goal and a specific practice activity. See the linked action map for the full chain.
Cognitive Load Theory
The Three.js scene reduces extraneous load by visualising abstract systems. Learners focus on the decision, not the interface.
Situated Cognition
The environment matches the real context. Practice happens where the skill will be performed.
Kirkpatrick L1-L4
Evaluation designed for all four levels: reaction, learning, behavior, results. See the linked evaluation plan.
Pre-committed targets (agreed with stakeholders before build, not retrofitted):
Teams rate the drill ≥4/5 for 'matching our review meetings'
L1 · Reaction
Teams rate the drill ≥4/5 for 'matching our review meetings'
L2 · Learning
≥80% diagnose all three cohorts correctly on first pass
L3 · Behavior
Quarterly reviews open with the learning family, not completion
L4 · Results
Interventions ship against diagnosed signals; fewer relaunches of unbroken content
Quarterly reviews kept producing interventions aimed at whatever was loudest — usually the top L1 comment or the completion number. The drill's premise: completion and satisfaction measure exposure, deltas and drop-offs measure learning, and the order you read them in IS the skill. The proposal was a diagnosis-gated metric drill-down: three cohorts with three different diseases behind one dashboard grammar, and interventions that stay locked until you have named the real signal.
Dashboard-training on metric definitions considered · rejected
Reasonable first response. Rejected because the team could define every metric — they still prescribed nudges for a cohort whose completion was 92% and learning was negative. Definitions are not the sequencing discipline; the gate in the UI enforces what definitions cannot.
A weekly data-review meeting considered · rejected
Collaborative and cheap. Rejected because meetings reward the loudest voice, and the loudest voice is precisely the top L1 comment. The drill's whole design — diagnosis before prescription, scored — is what an unstructured meeting cannot enforce.